

Proving AI coaching effectiveness requires tracking three measurement levels: adoption patterns (frequency and conversation depth), behavioral changes (direct report feedback and skill application), and business outcomes (retention and team performance). Real platforms show measurable impact within 90 days.
Proving effectiveness means demonstrating that managers apply new behaviors consistently, direct reports notice measurable improvement, and organizational outcomes shift positively.
Traditional coaching proves value through anecdotal feedback and executive testimonials. AI coaching enables quantitative measurement across adoption signals, behavioral changes, and business results.
Weekly active users and session counts mean nothing if managers don't change behavior. A platform with 80% weekly engagement sounds impressive until you realize those managers aren't applying what they learn.
What actually matters: Does the manager apply coaching guidance in real situations? Does their team notice improvement? Do organizational metrics move?
Track engagement frequency, conversation depth, and usage patterns. Managers using AI coaching three or more times weekly with conversations averaging five or more exchanges show higher skill application rates than occasional users.
Frequency metrics:
• Weekly active users (baseline)
• Users engaging three or more times per week (strong predictor)
• Repeat usage within 24 hours of initial interaction (habit formation)
Depth indicators:
• Average conversation length of five or more exchanges (real problem-solving, not surface questions)
• Follow-up questions asked (trust in guidance)
• Topics explored per session (breadth of application)
Proactive versus reactive engagement:
• Percentage of coaching triggered by observation versus user initiation
• Post-meeting feedback acceptance rates
• Real-time guidance application during live situations
Platforms that proactively offer feedback generate sustained engagement because they eliminate the friction of remembering to seek help. Generic tools require managers to remember to ask for help, describe context, and apply guidance later.
A manager who has three deep, contextual coaching conversations per week demonstrates fundamentally different engagement than one who logs in daily for superficial interactions. Deep engagement involves managers presenting real challenges, exploring multiple approaches, and returning to report outcomes after applying coaching guidance.
Direct report feedback, manager self-assessment alignment, and observed skill application in real situations provide the strongest evidence of behavioral change.
Direct report indicators:
• Manager Net Promoter Score (would you recommend your manager to others, measured on a -100 to +100 scale)
• Upward feedback survey results on specific competencies (delegation, feedback quality, conflict resolution)
• Unsolicited positive feedback frequency
• Team engagement scores correlated to manager coaching usage
Manager self-assessment:
• Confidence ratings on specific skills before and after coaching
• Self-reported application of coaching guidance
• Alignment between self-perception and direct report feedback
The gap between how managers see themselves and how their teams experience them reveals blind spots coaching helps close.
Observable skill application:
• Quality of feedback delivered (measured through 360 reviews)
• Meeting effectiveness scores
• Conflict resolution speed and outcomes
• Delegation patterns
Context matters. Generic tools provide generic advice that managers may or may not apply. Platforms that observe actual meetings and communications can measure real behavior change by comparing guidance given to actions taken.
As Melinda Wolfe, former CHRO at Bloomberg, Pearson, and GLG, notes: "If we can finally democratize coaching—make it specific, timely, and integrated into real workflows—we solve one of the most chronic issues in the modern workplace."
Link coaching adoption to retention rates, promotion readiness, team performance metrics, and time-to-productivity for new managers. The strongest business case emerges when you can show that managers using AI coaching have lower team turnover, faster direct report development, and higher team performance scores than managers who don't.
Retention and engagement:
• Team turnover rates for coached versus non-coached managers
• Employee engagement scores by manager coaching usage
• Regrettable attrition (losing people you wanted to keep) correlation to manager development
Performance outcomes:
• Team performance ratings
• Goal achievement rates
• Project delivery metrics
• Customer satisfaction scores for customer-facing teams
Development acceleration:
• Time-to-productivity for new managers
• Promotion readiness timelines
• Succession pipeline strength
• Internal mobility rates
Cost avoidance:
• Reduced need for HR escalations
• Lower external coaching spend
• Decreased training program redundancy
• Fewer performance improvement plans
Establish baselines before deployment, then track these metrics quarterly to demonstrate sustained impact. Organizations that wait for annual review cycles miss the opportunity to course-correct and optimize adoption.
Retention impact deserves attention given the high cost of employee turnover. According to SHRM, replacing an employee costs 6-9 months of salary when accounting for recruiting, onboarding, lost productivity, and knowledge loss. Managers who receive coaching on career development conversations, recognition, and creating inclusive team environments see measurably lower voluntary turnover on their teams.
Focus on adoption velocity, initial engagement patterns, and early behavior change signals rather than waiting for long-term business outcomes. The first 90 days establish whether your AI coaching investment will succeed or stall.
Week 1-4:
• Initial activation rate (percentage of invited users who complete onboarding)
• First conversation completion rate
• Average time from invitation to first meaningful interaction
Week 5-8:
• Repeat usage rate (users returning within seven days of first session)
• Conversation depth (average exchanges per session)
• Topic diversity (range of challenges explored)
Week 9-12:
• Users engaging three or more times weekly
• Proactive coaching acceptance rates (for platforms that offer real-time feedback)
• Early behavioral change indicators (improved meeting effectiveness scores)
Red flags:
• Activation rates below 60%
• Repeat usage rates below 40%
• Average conversation depth under three exchanges
These patterns indicate the platform isn't delivering value or isn't integrated into workflow effectively. Organizations that track these leading indicators can intervene quickly to improve adoption.
Early feedback collection complements quantitative metrics during the initial 90 days. Structured interviews with early adopters reveal what's working, what's confusing, and what additional support managers need. This qualitative data helps organizations refine their implementation approach before patterns become entrenched.
Start with clear baselines, establish leading and lagging indicators, and create a measurement cadence that enables course correction without overwhelming your team.
Baseline establishment:
Capture current state data before deployment. Document current manager effectiveness scores, team engagement levels, turnover rates, and time-to-productivity for new managers. Without baselines, you can't prove impact.
Leading indicators (predict future success):
• Weekly engagement patterns
• Conversation depth
• Proactive coaching acceptance rates
• Manager confidence scores on specific competencies
Lagging indicators (demonstrate business impact):
• Manager Net Promoter Score (quarterly)
• Team engagement scores
• Retention rates
• Promotion readiness
• Performance outcomes
Measurement cadence:
• Track adoption metrics weekly
• Track behavioral change indicators monthly
• Track business outcomes quarterly
This rhythm enables optimization without creating reporting fatigue.
Reporting structure:
Connect metrics to business outcomes. Show adoption trends, highlight behavioral changes with direct report feedback, and demonstrate business impact through retention and performance data. The narrative matters as much as the numbers.
Organizations that build comprehensive measurement frameworks from day one prove ROI faster and optimize adoption more effectively than those that retrofit measurement after deployment.
The sophistication of your measurement framework should match your organizational maturity and available resources. Early-stage implementations might focus on a core set of adoption and behavioral metrics, while mature programs can incorporate advanced analytics like predictive modeling of manager effectiveness. Starting simple and adding complexity over time works better than attempting comprehensive measurement from day one.
Privacy and ethical considerations shape measurement framework design. While comprehensive behavioral tracking enables sophisticated analysis, it can also create employee concerns about surveillance and data usage. Transparent communication about what data is collected, how it's used, and how privacy is protected builds trust that enables effective measurement. Aggregate reporting that protects individual privacy while revealing organizational patterns strikes the right balance.
The comparison between coached and non-coached managers provides powerful evidence of impact but requires careful design to avoid selection bias. Managers who voluntarily adopt coaching might differ systematically from those who don't in ways that affect outcomes independent of coaching effectiveness. Randomized controlled trials, propensity score matching, or other quasi-experimental designs strengthen causal claims about coaching impact.
The following table summarizes the key metrics across adoption, behavioral change, and business outcomes that organizations should track to prove AI coaching effectiveness:
Data Breakdown:
• Metric Category: Adoption - Frequency | Specific Metrics: Weekly active users | Measurement Frequency: Weekly | Target Benchmark: 70%+ of invited users
• Metric Category: Adoption - Frequency | Specific Metrics: Users engaging 3+ times per week | Measurement Frequency: Weekly | Target Benchmark: 40%+ of active users
• Metric Category: Adoption - Depth | Specific Metrics: Average conversation exchanges | Measurement Frequency: Weekly | Target Benchmark: 5+ exchanges per session
• Metric Category: Adoption - Depth | Specific Metrics: Follow-up questions per session | Measurement Frequency: Weekly | Target Benchmark: 2+ follow-ups
• Metric Category: Adoption - Integration | Specific Metrics: Proactive coaching acceptance rate | Measurement Frequency: Weekly | Target Benchmark: 60%+ acceptance
• Metric Category: Behavioral - Direct Report | Specific Metrics: Manager Net Promoter Score | Measurement Frequency: Quarterly | Target Benchmark: +20 or higher
• Metric Category: Behavioral - Direct Report | Specific Metrics: Upward feedback competency scores | Measurement Frequency: Quarterly | Target Benchmark: 10%+ improvement
• Metric Category: Behavioral - Direct Report | Specific Metrics: Team engagement scores | Measurement Frequency: Quarterly | Target Benchmark: 5%+ improvement
• Metric Category: Behavioral - Self Assessment | Specific Metrics: Manager confidence ratings | Measurement Frequency: Monthly | Target Benchmark: 15%+ improvement
• Metric Category: Behavioral - Observable | Specific Metrics: Meeting effectiveness scores | Measurement Frequency: Monthly | Target Benchmark: 10%+ improvement
• Metric Category: Behavioral - Observable | Specific Metrics: Feedback quality ratings | Measurement Frequency: Quarterly | Target Benchmark: Measurable improvement
• Metric Category: Business - Retention | Specific Metrics: Team turnover rate | Measurement Frequency: Quarterly | Target Benchmark: 15%+ reduction
• Metric Category: Business - Retention | Specific Metrics: Regrettable attrition rate | Measurement Frequency: Quarterly | Target Benchmark: 20%+ reduction
• Metric Category: Business - Performance | Specific Metrics: Team performance ratings | Measurement Frequency: Quarterly | Target Benchmark: 10%+ improvement
• Metric Category: Business - Performance | Specific Metrics: Goal achievement rates | Measurement Frequency: Quarterly | Target Benchmark: 5%+ improvement
• Metric Category: Business - Development | Specific Metrics: Time-to-productivity (new managers) | Measurement Frequency: Quarterly | Target Benchmark: 25%+ reduction
• Metric Category: Business - Development | Specific Metrics: Promotion readiness timeline | Measurement Frequency: Quarterly | Target Benchmark: 20%+ acceleration
• Metric Category: Business - Cost | Specific Metrics: HR escalations | Measurement Frequency: Quarterly | Target Benchmark: 30%+ reduction
• Metric Category: Business - Cost | Specific Metrics: External coaching spend | Measurement Frequency: Quarterly | Target Benchmark: 40%+ reduction
This framework provides a comprehensive view of AI coaching effectiveness across all critical dimensions, enabling organizations to demonstrate value to stakeholders while identifying optimization opportunities.
Proving AI coaching effectiveness requires tracking three distinct levels: adoption patterns, behavioral change metrics, and business outcomes. Each level provides different insights and operates on different timeframes, but together they create a comprehensive picture of coaching impact.
The first 90 days establish whether your investment will succeed. Focus on adoption velocity, engagement patterns, and early behavior change signals rather than waiting for long-term business outcomes to materialize. Organizations that track leading indicators during this critical period can intervene quickly to optimize adoption and prevent early challenges from becoming entrenched patterns.
Direct report feedback provides the strongest evidence of behavioral change. Track Manager Net Promoter Score, upward feedback on specific competencies, and team engagement scores to understand whether managers are applying coaching guidance in ways their teams notice and value. The gap between manager self-perception and team experience reveals the blind spots that coaching helps address.
Build a measurement framework that connects adoption metrics to behavioral change to business outcomes, with weekly tracking of leading indicators and quarterly assessment of lagging indicators. This multi-level approach demonstrates value to different stakeholders: executives care about business outcomes, HR leaders focus on behavioral change, and program managers need adoption metrics to optimize implementation.
Establish baselines before deployment. Without current state data on manager effectiveness, team engagement, retention rates, and performance outcomes, you cannot prove impact. Organizations that document baseline conditions create the foundation for rigorous impact assessment and compelling ROI narratives.
Organizations that establish clear measurement frameworks from day one demonstrate value faster and optimize adoption more effectively. The discipline of defining success metrics before deployment forces clarity about program objectives, creates accountability for results, and enables data-driven optimization throughout the implementation journey.
Ready to prove AI coaching works at your organization? Pascal by Pinnacle helps you track the metrics that matter. Schedule a demo at https://www.pinnacle.us.com/demo to see how we measure adoption, behavioral change, and business outcomes in real time.
Header photo by Austin Distel on Unsplash

.png)
.webp)
“Thank you for setting the great foundation for my promotion; now I have a plan!"

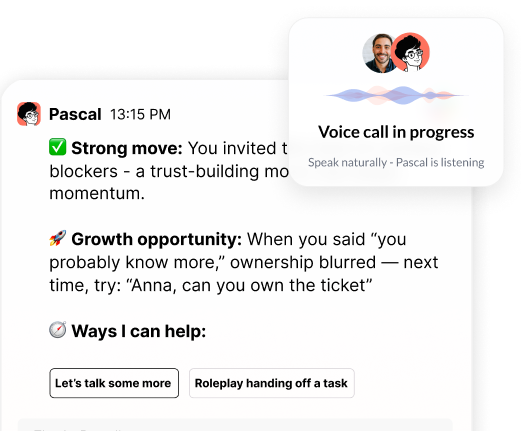
Curious to see how AI Coaching can 10X the impact and scale of your development initiatives. Book a demo today for: