

Proving AI coaching effectiveness requires tracking three interconnected levels: adoption patterns that predict sustained engagement, behavioral changes that show real skill development, and business outcomes that justify continued investment.
Weekly active users and session counts tell you nothing about whether managers are actually improving. An 80% weekly usage rate means nothing if managers aren't applying what they learn. Satisfaction scores don't predict whether direct reports notice any difference in their manager's behavior.
The measurement gap exists because most organizations track engagement vanity metrics instead of the three levels that actually matter: adoption patterns that predict sustained use, behavioral changes managers apply in real situations, and business outcomes like retention and team performance. Traditional LMS completion rates measure consumption, not application. Satisfaction surveys capture sentiment, not skill development.
The "last mile problem" occurs when companies invest in tools, announce rollouts, and track usage dashboards but never connect those activities to actual performance improvement. You're measuring activity, not impact.
The traditional measurement trap:
• LMS platforms report 80% completion rates but show minimal behavior change
• Engagement surveys happen quarterly, missing real-time behavioral shifts
• Usage dashboards show logins and sessions, not whether managers applied what they learned
• Satisfaction scores reflect how people feel about the tool, not whether it changed their leadership
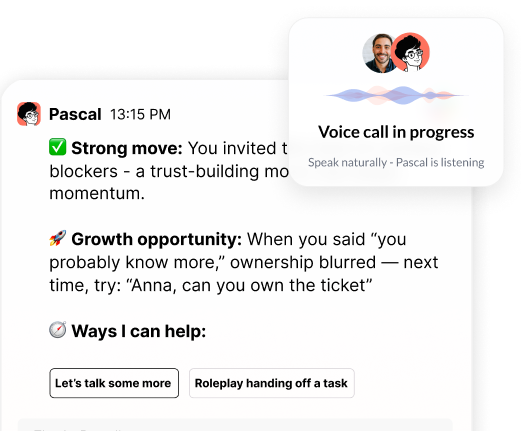
AI coaching platforms that integrate with your existing workflow (meeting tools, Slack, Teams) can track all three measurement levels through embedded presence. When your AI coach observes real interactions, it captures behavioral data in the flow of work without requiring managers to self-report.
Track three distinct measurement levels simultaneously: adoption leading indicators that predict sustained engagement, behavioral change metrics that show real skill development, and business outcomes that justify continued investment.
Level 1: Adoption Leading Indicators
These metrics predict whether managers will sustain usage beyond the initial novelty period:
• Conversation depth: Multi-turn dialogues (measured by number of exchanges per session) versus single questions indicate genuine engagement
• Return usage rate: Managers coming back within 48 hours signal the tool provided real value
• Proactive engagement acceptance: Responding to real-time feedback shows trust in the system
• Context richness: Providing situation details versus generic queries demonstrates serious application
• Feature breadth: Using roleplay, feedback prep, and career conversations beyond basic Q&A
Level 2: Behavioral Change Metrics
These indicators show whether managers are applying new skills in real situations:
• Direct report pulse surveys: "Has your manager improved in [specific skill]?" asked monthly
• 360 feedback comparison: Baseline assessment versus 90-day checkpoint on specific competencies
• Specific behavior tracking: Feedback frequency, 1-on-1 quality scores, delegation effectiveness
• Manager self-assessment: Progress against your organization's competency framework
• Peer observation data: For managers of managers, tracking how they develop their teams
Level 3: Business Outcomes
These results justify continued investment and scaling decisions:
• Manager Net Promoter Score: Track changes from baseline to 90-day checkpoint
• Team retention rates: Focus on regrettable attrition on high-performing teams
• Performance review quality scores: Consistency and specificity of feedback documentation
• Time-to-productivity: How quickly new managers reach full effectiveness
• Employee engagement survey results: Manager-specific questions showing improvement
Data Breakdown:
• Vanity Metric: Weekly Active Users | Why It Fails: Shows logins, not learning application | What to Track Instead: Return rate within 48 hours + conversation depth
• Vanity Metric: Session Duration | Why It Fails: Longer isn't better if nothing changes | What to Track Instead: Behavioral change reported by direct reports
• Vanity Metric: Satisfaction Scores | Why It Fails: Sentiment doesn't predict skill development | What to Track Instead: 360 feedback shifts on specific competencies
• Vanity Metric: Course Completions | Why It Fails: Consumption doesn't equal application | What to Track Instead: Manager NPS and team retention rates
• Vanity Metric: Total Questions Asked | Why It Fails: Volume doesn't indicate quality | What to Track Instead: Proactive engagement acceptance rate
Establish baseline measurements before launch, define success thresholds for each measurement level, and schedule checkpoint reviews at 30, 60, and 90 days. Start with a pilot cohort of 20-50 managers to validate your measurement approach before scaling.
Week 1: Collect Baseline Data
Gather current 360 scores, manager NPS from your latest engagement survey, and team retention rates. Document existing performance review quality scores if you have them. This baseline proves whether your AI coaching investment creates measurable change.
Week 2: Define Pilot Cohort and Control Group
Select 20-50 managers representing different functions, experience levels, and performance ratings. Identify a comparable control group (matched by department, tenure, and current performance level) that won't receive AI coaching initially. This comparison group isolates the impact of your coaching intervention from other organizational changes.
Week 3: Set Up Automated Data Collection
Configure direct report pulse surveys asking specific questions about manager behavior changes. Integrate usage analytics from your AI coaching platform. Capture both quantitative metrics (conversation depth measured by turns per session, return rate within 48 hours) and qualitative feedback from the people who will notice behavioral changes first: direct reports.
Week 4: Establish Reporting Cadence
Schedule 30-day, 60-day, and 90-day checkpoint reviews with stakeholders. Define what success looks like at each milestone. Create a dashboard showing adoption leading indicators, behavioral change metrics, and business outcomes in one view.
Platforms that join meetings and integrate with Slack and Teams eliminate the self-reporting burden that undermines traditional measurement approaches. When your AI coach observes real interactions, you get accurate data on whether managers are applying new skills in actual work situations.
For change management best practices that support successful AI coaching adoption, see Leading through the AI shift: lessons from HubSpot, Zapier, and Marriott.
Set realistic benchmarks for each checkpoint. Direct reports should notice improvement in specific skills within 60 days, while business outcomes like manager NPS typically show measurable improvement by the 90-day mark.
30-Day Benchmarks:
• 70% of pilot managers have used the tool at least once
• 40% return for a second session within 48 hours
• Qualitative feedback themes: "This helped me prepare for a difficult conversation"
• Early adopters sharing specific use cases with peers
60-Day Benchmarks:
• 50% of managers use the tool weekly
• 30% of direct reports notice specific improvements in manager behavior
• Managers report time savings on coaching prep and feedback planning
• Behavioral changes visible in specific areas: feedback quality, 1-on-1 effectiveness, delegation
90-Day Benchmarks:
• Measurable lift in direct report satisfaction with manager effectiveness (compare to baseline)
• Improvement in Manager Net Promoter Score among engaged users (compare to control group)
• Documented time savings per manager on development support
• Clear ROI justification for scaling beyond pilot cohort
Platforms with contextual awareness (knowledge of your people, their goals, and their daily work) and proactive engagement (reaching out rather than waiting to be asked) help managers develop habits that stick.
FAQ Schema Suggestion:
• Q: What results should I expect in 30 days from AI coaching?
• A: 70% pilot adoption, 40% return usage within 48 hours, qualitative feedback on specific use cases
• Q: What results should I expect in 60 days from AI coaching?
• A: 50% weekly usage, 30% direct reports noticing behavioral improvements, measurable time savings
• Q: What results should I expect in 90 days from AI coaching?
• A: Measurable improvement in manager effectiveness scores, NPS lift versus control group, documented time savings
AI coaching delivers measurable ROI at a fraction of traditional executive coaching costs while reaching 100% of your manager population instead of just senior leaders. Traditional coaching costs $3,000-15,000 per person annually and serves only executives, while learning management systems show low completion rates with minimal behavior change.
Data Breakdown:
• Approach: Executive Coaching | Annual Cost Per Person: $5,000-15,000 | Population Reached: Top 5% only | Time to Impact: 6-12 months
• Approach: LMS/Training | Annual Cost Per Person: $200-500 | Population Reached: 100% | Time to Impact: 3-6 months
• Approach: Traditional Manager Training | Annual Cost Per Person: $1,000-3,000 | Population Reached: 20-30% | Time to Impact: 3-6 months
• Approach: AI Coaching | Annual Cost Per Person: $50-200 | Population Reached: 100% | Time to Impact: 30-90 days
AI coaching provides 24/7 support, real-time feedback in actual work situations, and scales across your entire organization. Traditional coaching works but doesn't scale economically. LMS platforms have high completion rates but low application rates because they're disconnected from the flow of work. Workshop training creates knowledge but rarely changes behavior because there's no reinforcement mechanism when managers face real situations.
Generic AI tools like ChatGPT and Claude lack organizational context and proactive engagement. They can't observe your managers in action, don't know your competency framework, and wait passively for managers to remember to use them.
For a deeper analysis of how AI coaching transforms leadership development economics, see AI Coaching: The future of leadership development is here.
• Track three measurement levels simultaneously: Adoption leading indicators predict sustained engagement, behavioral change metrics show real skill development, and business outcomes justify continued investment
• Start with a 20-50 manager pilot cohort: Establish baseline measurements, define success thresholds, and validate your measurement approach before scaling
• Set realistic 30/60/90-day benchmarks: Compare pilot results to control group and baseline data to isolate coaching impact from other variables
• AI coaching reaches 100% of managers at a fraction of traditional coaching costs: Scale personalized development across your organization instead of limiting it to senior leaders
• Platforms that integrate with workflow tools capture behavioral data without self-reporting burden: Measurement accuracy improves when your AI coach observes real interactions
Pascal joins your meetings, integrates with Slack and Teams, and provides real-time coaching in the flow of work. See how Pascal works inside Slack to understand how AI coaching delivers measurable manager improvement at scale.
Header photo by Vitaly Gariev on Unsplash

.png)
.webp)
“Thank you for setting the great foundation for my promotion; now I have a plan!"

Curious to see how AI Coaching can 10X the impact and scale of your development initiatives. Book a demo today for: