

HR leaders waste budget on coaching programs they can't measure. The fix: track adoption patterns that predict sustained use, behavioral changes visible to direct reports, and business outcomes like retention. Most organizations measure activity (course completions, login frequency) instead of impact (whether managers actually improve).
Your coaching program shows 90% completion rates and 4.5-star satisfaction scores. Your managers still can't delegate, give feedback, or run effective one-on-ones. The problem: you're measuring the wrong things.
Traditional metrics—course completions, login frequency, satisfaction surveys—measure engagement, not effectiveness. SafetyCulture research shows 74% of training investment is forgotten within weeks. The question your metrics must answer: "Did this manager actually get better at their job?"
Most coaching platforms rely on self-reported progress. Managers rate themselves on "communication skills" or "emotional intelligence" without any external validation. This creates a measurement gap: high satisfaction scores with zero behavior change.
Effective coaching measurement tracks three interconnected levels: adoption patterns, behavioral change, and business outcomes.
Frequency matters more than total user count. A manager who uses coaching weekly for six months signals different intent than one who completes onboarding and disappears.
Track repeat usage within 30 days. Managers who return when facing difficult situations (not just during onboarding) build coaching into their workflow. Measure time-to-value: how quickly do new users engage meaningfully?
Depth of engagement separates surface-level questions ("how do I write a performance review?") from real leadership challenges ("my top performer just quit—what did I miss?"). Session duration and conversation complexity reveal whether managers tackle substantive problems.
Adoption Metrics That Predict Success:
Data Breakdown:
• Surface Metric: Total registered users | Predictive Indicator: Weekly active users (3+ sessions)
• Surface Metric: Login count | Predictive Indicator: Average session duration
• Surface Metric: Course completion rate | Predictive Indicator: Repeat usage within 30 days
• Surface Metric: Satisfaction score | Predictive Indicator: Conversation topic depth
360 feedback reveals specific behaviors: "consistently provides specific praise for good work" or "delegates effectively without micromanaging." Qualtrics research shows specific behavioral feedback correlates more strongly with manager effectiveness than general ratings.
Manager Net Promoter Score (mNPS) asks direct reports: "Would you recommend working for this manager?" Track this quarterly. A manager moving from -20 to +40 over six months shows measurable improvement.
Direct report assessments answer: "Has your manager improved over the past 90 days?" This simple question provides concrete evidence of behavior change. Compare cohorts: managers using coaching versus those who don't.
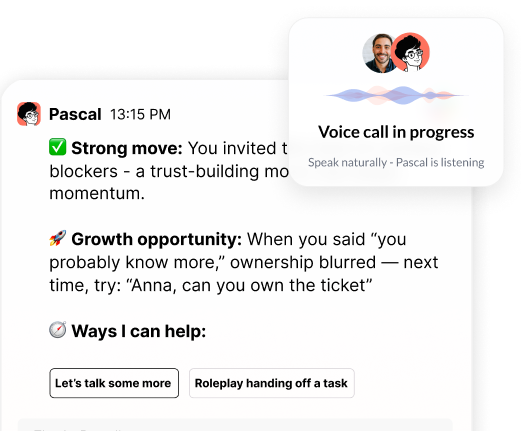
Real-time behavioral observation separates platforms that rely on self-reporting from those that track actual skill application. Some platforms observe whether managers use learned techniques in meetings and conversations, creating a quantitative record of development.
Team retention rates reveal whether better-coached managers keep talent. Track retention in teams led by managers who actively use coaching versus those who don't. A 15% retention lift in coached cohorts justifies program investment.
Promotion readiness shows if managers develop their direct reports. Track internal promotion rates from teams with coached managers.
Team performance metrics—delivery against roadmaps, sprint velocity, sales attainment—connect coaching to business results. If coaching improves manager effectiveness, team output should reflect it.
Time saved matters to CFOs. Managers who handle difficult conversations effectively reduce HR escalations, freeing your team for strategic work. At Delta Airlines, review cycles that used to take days now take under an hour.
Annual performance reviews and quarterly engagement surveys offer occasional snapshots. Response rates drop each cycle. Results arrive months after the behaviors you're trying to change.
Continuous measurement provides real-time insights from actual work interactions. You identify skill deficiencies as they emerge, not months later during a survey debrief.
The trade-off: traditional methods feel familiar and require less infrastructure. Continuous measurement requires platforms that integrate with your team's daily workflow (Slack, email, calendar). The payoff: you see communication breakdowns, delegation failures, and feedback gaps when they happen, allowing targeted interventions before problems escalate.
Privacy protection remains critical. Look for SOC2 compliance, commitments not to train AI models on your data, and anonymized aggregate reporting that protects individual manager privacy while giving leadership visibility into organizational patterns.
Audit whether you're measuring activity or impact. High engagement with no measurable improvement means you're tracking the wrong things.
Ask diagnostic questions: Can you name three specific behaviors your managers improved in the last quarter? Do direct reports report measurable improvement? Has team retention improved in cohorts with coached managers?
Common failure patterns: high completion rates but no behavior change (the "check-the-box" problem), positive satisfaction scores but no skill application, strong initial engagement that drops after 30 days.
The fix: shift to measurement that observes behavior in the flow of work. Track whether managers actually apply skills in real meetings and conversations, not just whether they completed a module or reported feeling satisfied.
Both matter. Quantitative metrics win budget battles. Qualitative insights explain what's working and guide program refinement.
Quantitative metrics speak the language of executives: retention lift in coached manager cohorts, Manager NPS increases, hours saved per manager annually, promotion rates from teams with coached managers.
Qualitative metrics refine programs: specific behavior changes direct reports notice, manager testimonials about breakthrough moments, examples of difficult conversations handled more effectively.
The most effective measurement strategies combine hard data with rich qualitative feedback. Connect quantitative behavioral scorecards with specific examples of improved interactions. This creates a complete picture of manager development and connects to asking team members for feedback effectively.
Coaching metrics reveal which development interventions change behavior and which waste budget. Track behavioral change at scale to identify which competencies improve fastest, which manager populations need different approaches, and which training investments deliver returns.
Real-time data shows skill deficiencies as they emerge. Instead of waiting for annual engagement surveys, you see communication breakdowns, delegation failures, and feedback gaps when they happen.
Aggregate behavioral data replaces low-fidelity snapshots with continuous performance insights. You can measure cultural transformations quantitatively, track whether operating principles actually show up in daily work, and identify teams requiring support.
This transforms coaching from an individual development tool into a strategic lever for organizational performance. You allocate budget based on what actually works, not what feels right or what vendors promise.
• Track three levels: Adoption patterns predict sustained use, behavioral changes prove skill development, business outcomes justify investment.
• Activity metrics mislead: Completion rates mean nothing if managers don't apply skills in real work situations.
• Continuous beats periodic: Real-time behavioral observation provides higher-fidelity insights than quarterly surveys or annual reviews.
• Combine quantitative and qualitative: Hard data wins budget battles, qualitative insights reveal what works and guide refinement.
• Measure behavior change, not satisfaction: 360 feedback, manager NPS, and direct report assessments reveal whether coaching drives improvement.
Ready to move beyond activity metrics? See how Pascal tracks behavioral change in the flow of work.
Header photo by Vitaly Gariev on Unsplash

.png)
.webp)
“Thank you for setting the great foundation for my promotion; now I have a plan!"

Curious to see how AI Coaching can 10X the impact and scale of your development initiatives. Book a demo today for: